Acid Deposition Effects to Forests and Streams in the Southern Appalachian Mountains
Patricia F. Brewer, Timothy J. Sullivan, Jack Cosby, Ron Munson
SAMI Technical
Coordinator, Interchange Building, 59 Woodfin Place, Asheville, NC 28801; E&S Environmental Chemistry,
Inc., P. O. Box 609, Corvallis, OR
97339; Department of Environmental Sciences, Clark Hall, University of
Virginia, Charlottesville, VA 22903;
Tetra Tech, Inc., 2696 N University Ave Stuite 255, Provo, Utah 84604
ABSTRACT
The Southern Appalachian Mountains Initiative (SAMI) is a voluntary partnership of state and federal agencies, industry, environmental groups, academia, and interested public. SAMI was established to identify and recommend air emissions management strategies to remedy existing and prevent future adverse air quality impacts to natural resources in the Southern Appalachian Mountains, with particular focus on national parks and wilderness areas. SAMI’s integrated assessment is focusing simultaneously on ozone, visibility impairment, and acid deposition.
SAMI’s acid deposition assessment is being conducted in two phases. In Phase I, the responses of three watersheds to changes in future deposition levels were tested using two different watershed response models, the Model of Acidification of Groundwater in Catchments (MAGIC) and the Nutrient Cycling Model (NuCM). Model results were used to evaluate the potential reductions in deposition that might be needed to protect sensitive resources. SAMI’s Phase II analyses will evaluate aquatic and forest responses throughout the Southern Applachian Mountains to changes in deposition resulting from SAMI emissions management strategies. Current regional distributions of aquatic and forest resources and resource responses to changes in future deposition levels will be described.
INTRODUCTION
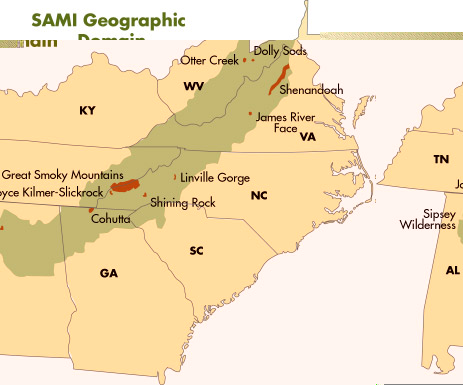
The Southern Appalachian Mountains Initiative (SAMI) is a voluntary partnership to identify and recommend strategies to protect the natural resources of the Southern Appalachian Mountains. SAMI is focusing simultaneously on four air quality issues: visibility impairment, acid deposition impacts to aquatic and forest ecosystems, and ozone impacts to forest ecosystems. The geographic area of SAMI’s Integrated Assessment includes the Southern Appalachian Mountains region with particular attention to ten Class I areas (Figure 1). Under the 1977 Clean Air Act Amendments, national parks and wilderness areas designated as Class I are afforded special protection of air quality and air quality related values (e.g. streams, forests, soils, wildlife, vistas).
Figure 1. Geographic Domain of the Southern Appalachian Mountains Initiative,
including 10 Class I national parks and wilderness areas.
SAMI’s Integrated Assessment is using linked emissions, atmospheric transport, environmental effects and socioeconomic models to evaluate the impacts of ozone, aerosols, and acid deposition1, 2. The technical results will guide policy recommendations to protect natural resources in the Southern Appalachian Mountains. Emissions management strategies developed by SAMI’s Policy Committee are being tested in the linked assessment models. The strategies represent air regulatory requirements (e.g. 1990 Clean Air Act Amendments) that were being implemented at the time of SAMI’s formation, expected emissions reductions under recent federal regulatory actions, and alternative strategies that SAMI might recommend for regional, state, or community-based actions.
Emissions inventories are being developed for each strategy, including the major precursor emissions and major source categories in the eastern United States. The air quality model will evaluate emissions inventories for two future years, 2010 and 2040. Emissions inventories are also being developed for 2000, 2020, and 2030 to better define future deposition trends for the environmental effects models inputs.
Ozone, aerosol, and acid deposition are being evaluated in a single atmospheric model, the Urban Regional Multi-scale model 3, 4. An episodic atmospheric modeling approach is being applied to represent the complex meteorology and atmospheric processes in the mountainous terrain. Air quality in the Southern Appalachian Mountains is being modeled for 68 days in nine 7-10 day-long episodes selected from the period of record 1991 to 1995. Results for the 68 modeling days will be combined to represent the seasonal ozone and annual deposition and aerosol metrics that are most relevant for evaluating aquatic, forest, and visibility impacts. Air quality in 2010 and 2040 will be projected as a function of SAMI emissions strategies. For acid deposition, the 9 episodes will be weighted to represent annual average wet and annual average dry deposition. The changes in projected future wet plus dry deposition as a function of SAMI strategies will be used in the acid deposition effects models to project aquatic and forest responses to SAMI strategies. Air quality model results will also inform visibility analyses and models of forest response to ozone.
Acid deposition Assessment
The objectives of SAMI’s acid deposition assessment are to:
1) characterize the sensitivity of aquatic and forest resources in the Southern Appalachian Mountains to acid deposition
2) project the responses of streams and forests to changes in future levels of acid deposition.
SAMI’s acid deposition assessment is being performed in two phases. Phase I analyses demonstrated the stream and forest responses of three watersheds and provided early guidance to SAMI strategy design on the changes in sulfate and nitrate deposition that might be needed to protect sensitive resources 5,6. Phase II analyses will provide a regional characterization of the sensitivity of streams and forests throughout the Southern Appalachian Mountains. The same watershed models that were used in Phase I are being applied in Phase II to characterize the responses of streams and forests across the SAMI region. Resource responses to SAMI emissions strategies will be projected for the modeled watersheds and extrapolated quantitatively to the population of streams and qualitatively to forest types represented by the modeled watersheds.
Resource Sensitivity to Acid Deposition
Watershed acidification
occurs when incoming acids exceed the buffering capacity of the geology, soils,
forest, and stream of a watershed. In
the southeastern United States, the resources most sensitive to acid deposition
generally occur in the Southern Appalachian Mountain region7. Within
Southern Appalachian Mountains the most sensitive aquatic resources are streams
in upland and mountainous areas, particularly in those areas where the
underlying geological materials supply very limited quantities of base cations
to neutralize incoming acids. Forests
that are most sensitive to acidification are spruce fir forests at high
elevation where high sulfur and nitrogen deposition levels exacerbate the
already naturally acidic soils.
The sensitivity of watersheds to acidification can be described as a function of several characteristics:
· Geology
· Geography/topography/elevation
· Soils
· Previous land use
· Forest cover type and growth rates
· Deposition (wet, dry, cloud)
Resource Classification
SAMI will characterize the current geographic distribution of resources sensitive to acidification. Stream and forest sensitivity to acidification will be classified using specific indicators of forest, stream, and fish population responses.
Acid neutralizing capacity (ANC) will be the primary indicator used to classify stream sensitivity. ANC is an indicator of the suitability of stream water for fish and aquatic invertebrate survival. Other stream water quality indicators are pH and concentrations of sulfate, nitrate, and aluminum. Streams will be classified into four ANC categories (ANC less than 0, 0-20, 20-50, and 50-150 meq/l). Studies in Virginia have correlated fish population survival to stream ANC values8. Native brook trout are more acid tolerant than brown and rainbow trout and other fish species. In Shenandoah National Park the numbers of fish species present range from 0-4 species in streams with ANC values near 0 meq/l to 6-8 species present in streams with ANC greater than 100 meq/l. Assuming that these results for Virginia trout streams can be extrapolated to other streams in the Southern Appalachian Mountains, ANC levels can be used as indicators of fish survival. Because fish populations are not affected by acid deposition when stream ANC values are greater than 150 meq/l, the responses of these non-sensitive streams to changes in acid deposition will not be modeled. However the frequency of occurrence of the non-sensitive streams in the SAMI region will be reported. Rivers in Southern Appalachia are generally well buffered and are not addressed in SAMI’s assessment.
Physiographic Provinces will also be used to classify stream sensitivity. Within each ANC class, streams will be further classified into three physiographic provinces: the Appalachian Plateau, the Ridge and Valley, and the Blue Ridge provinces. These physiographic provinces are good indicators of the underlying geological and physical factors that determine watershed sensitivity to acidification. A north-south gradient of sensitivity may exist within these physiographic provinces reflecting variation in climatic conditions and cumulative amounts of S and N deposition received over the past decades.
Forest community type (spruce fir, northern hardwood, or mixed hardwood forests) will be the primary indicator used to characterize forest sensitivity to acid deposition. Elevation, topography, previous land use, and disturbance histories (e.g. fire, insect, disease) are important factors that determine forest community type. Across forest community classes, ANC of soil solutions, base saturation (BS) of soils, and the ratio of calcium/aluminum in soils and foliage are additional indicators of forest sensitivity to acid deposition. An elevational gradient for forest community type is evident in the Southern Appalachian Mountains9. The spruce fir community exists at high elevations, with fir dominating at the highest elevations. At mid elevation, the northern hardwood forest community is comprised of beech, yellow birch, maples, and associated forest species. At low to mid elevation the mixed hardwood forest community can be further stratified by soil moisture (cove hardwood, hemlock-hardwood, submesic hardwood, pine-hardwood, and pine forests, in order from moist to dry sites). Site specific conditions (aspect, slope, topographic position) lead to wide variation in the specific mix of species in the northern hardwood and mixed hardwood forests. These same three forest community types will be used to classify forest sensitivity to ozone, although species sensitivity to ozone can be further subdivided within the northern hardwood and mixed hardwood forests.
Phase I acid deposition analyses
In Phase I, the responses of three forested watersheds to changes in levels of acid deposition were evaluated 5,6. The selected watersheds included a spruce fir forest and stream in Great Smoky Mountains National Park and two trout streams in mixed hardwood forests in Shenandoah National Parks. These three watersheds represent a range of geographic provinces, stream ANC classes, and forest community types (Table 1).
Table 1. Characteristics of watersheds evaluated for SAMI Phase I acid deposition analyses
|
Watershed |
Area (ha) |
Elevation (m) |
Stream ANC1 (Annual ave., meq/l) |
Physio-graphic Province |
Forest Community |
|
Noland Divide |
17.4 |
1678 to 1921 |
0-20 |
Blue Ridge |
Spruce fir |
|
White Oak Run |
515 |
500 to 900 |
0-20 |
Ridge and Valley |
Mixed (oak) hardwood |
|
North Fork Dry Run |
223 |
503 to 1036 |
80-100 |
Ridge and Valley |
Mixed (oak) hardwood |
1 ANC = Acid Neutralizing Capacity
Phase I
Methods:
Two watershed models (the Model of Acidification of Groundwater in Catchments, MAGIC, and the Nutrient Cycling Model, NuCM) were applied for the three Phase I watersheds to assess responses to changes in levels of sulfate, nitrate, and base cation deposition. The two models have both been demonstrated in previous regional and national assessments. MAGIC is a catchment model that integrates the combined impacts of physiographic features, geology, soils, and forest cover to project stream water quality. MAGIC operates on a monthly and annual timestep and has more aggregated data requirements than NuCM. NuCM tracks the specific hydrological and chemical processes that control the exchange of nutrients between the atmosphere, forest canopy, litter layer, forest soils, soil solutions, and the receiving stream. Daily and monthly meteorological inputs are required. Monthly and annual stream water quality responses to changes in future deposition levels were evaluated using both MAGIC and NuCM. Forest nutrient responses were evaluated using NuCM.
Site-specific measures of deposition, forest structure, soils, and water quality were used to initialize each of the watershed models. Five years of water quality monitoring data were used to calibrate the models and to evaluate modeled stream response to observed conditions. The MAGIC model was initialized with historic deposition trends for 1900 to 1990 that were derived from ASTRAP, a simple acid deposition transport model10.
Deposition Scenarios
Current and projected future deposition in the three watersheds were based on the same 1991 to 1995 meteorological and deposition records for Great Smoky Mountains National Park (GRSM) and Shenandoah National Park (SHEN) that were used for SAMI’s episode selection11 and air quality modeling3. Total deposition (wet, dry, and cloudwater/fog) for each site (Table 2) was based on measured wet deposition at each site for 1991 to 1995 and measures of dry and cloud water deposition from nearby sites in the two national parks5. Since dry and cloud water deposition measurements were not available for the entire 1991 – 1995 period, these values were estimated using the ratios of wet to dry or wet to cloud deposition from the available monitoring records for each park. The reference year was defined as 1995 for all sites and represented total annual average deposition for 1991 to 1995. Annual average deposition was repeated for each year of the simulation from 1995 to 2040.
Table 2. Annual average 1991-1995 deposition to three Phase I watersheds
|
Watershed |
Ion
Species |
Total (kg/ha/ yr)1 |
Wet (kg/ha/
yr)1 |
Dry (kg/ha/ yr)
1 |
Cloud/ Fog (kg/
ha/yr) 1 |
Volume (cm/yr)1 |
|
|
Noland Divide |
SO4 |
107.4 |
29.8 |
26.4 |
51.2 |
285 |
|
|
NO3 |
78.5 |
15.7 |
46.6 |
16.2 |
285 |
||
|
|
|||||||
|
White Oak Run |
SO4 |
40.3 |
17.2 |
9.9 |
13.2 |
105 |
|
|
NO3 |
41.0 |
9.7 |
19.3 |
12.0 |
105 |
||
|
|
|||||||
|
North Fork Dry Run |
SO4 |
44.7 |
21.6 |
9.9 |
13.2 |
121 |
|
|
NO3 |
43.5 |
12.2 |
19.3 |
12.0 |
121 |
||
1 Precipitation volume and sulfate
and nitrate deposition values from Cosby and Sullivan, 19998. Total
deposition calculated as sum of measured wet deposition at each watershed plus
estimated dry and cloud water deposition.
Deposition scenarios in the Phase I analyses were not linked to SAMI emissions strategies. The ten deposition scenarios were designed to represent a range of future deposition trends for sulfate (SO4), nitrate (NO3), and base cations. Annual average deposition for 1991 to 1995 was the basis for calculation of the future deposition trends. The percentage changes in annual average deposition for each scenario were repeated for every simulation year from 1996 to 2040:
1. No change from annual average deposition of SO4, NO3, and base cations
2. 30% SO4 reduction; 20% NO3 reduction
3. 30% SO4 reduction; 20% NO3 increase
4. 50% SO4 reduction; 40% NO3 reduction
5. 50% SO4 reduction; 20% NO3 increase
6. 30% SO4 reduction; 20% NO3 increase, 20% base cation reduction
7. 70% SO4 reduction; 20% NO3 reduction
8. 70% SO4 reduction; 20% NO3 increase
9. 70% SO4 reduction; 40% NO3 reduction
10. 70% SO4 reduction; 20% NO3 reduction, 20% base cation reduction
Phase I results
Changes in stream water quality and soil chemistry were evaluated as a function of the 10 future deposition trends. Results for the three watersheds can be used to evaluate the potential reductions in sulfate and nitrate deposition that would be required to protect these resources. Spatial analyses were not conducted in Phase I, nor was the portion of the total resources in the Southern Appalachian Mountains that these three watersheds represent defined. Regional assessment of resource sensitivity and responses to changes in future deposition levels will be considered in Phase II.
Deposition Trends
Total deposition (wet plus dry plus cloud water) of sulfate and nitrate used in the models for Noland Divide (GRSM) was nearly twice that used for White Oak Run and North Fork Dry Run (SHEN) (Table 2). The same percentage changes in sulfate, nitrate, and base cations were applied for the three watersheds, however because deposition levels were higher for Noland Divide, the values of deposition reductions were larger for Noland Divide.
Resource responses
The following indicators were used to represent aquatic and forest responses to deposition scenarios:
· Stream water quality measures (annual average ANC, pH, SO4, NO3, aluminum) as indicators of stream habitat suitability for aquatic organisms. For the purposes of this paper, only results for stream acid neutralizing capacity are reported.
· Base Saturation of soils and ratio of calcium to aluminum in soil solutions as indicators of the availability of nutrients for forest uptake and growth. For this paper, only the ratio of calcium to aluminum in soil solutions is reported.
Noland Divide:
The spruce fir forest of the Noland Divide watershed is an old growth, degrading forest; the fir are infested with the Balsam Wooly Adelgid. The soils are naturally acidic.
Under current conditions the ANC of the stream in Noland Divide watershed is 0-20 meq/l. The NuCM model projects that stream ANC would remain below 20 meq/l if deposition were to continue at current (1991-1995) sulfate and nitrate deposition levels between 1995 and 20406. None of the scenarios in the NuCM runs project ANC less than 0 in 2040. MAGIC runs project that ANC would drop below 0 for those scenarios with current or increased levels of NO3 deposition5. Both models project that SO4 deposition reductions of 50-70% and NO3 deposition reductions of 40% would prevent further decrease in ANC (Figure 2). By 2040 none of the Phase I scenarios resulted in an increase in ANC of the Noland Divide stream above 20 meq/l.
Figure 2. Trends in stream water acid neutralizing capacity (ANC) as function of changes in future deposition levels for the stream in the Noland Divide watershed in Great Smoky Mountains National Park
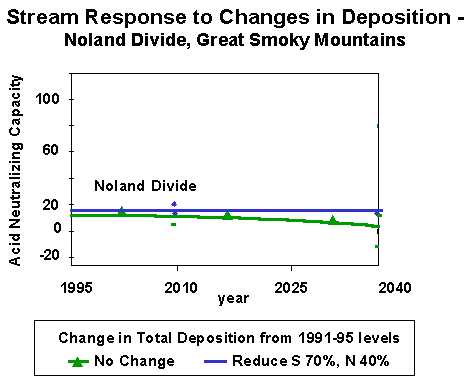
Noland Divide responded to changes in NO3 deposition within the first 3-5 years of the model simulations6. Responses to SO4 deposition were gradual and cumulative over the 50-year projection. These results are consistent with our understanding that biological processes mediate NO3 retention, while slower, soil-based properties delay the watershed response to changes in SO4 deposition. These results provide evidence that NO3 deposition exceeds the capacity of the slow-growing spruce fir forest to uptake N and that excess NO3 from deposition is contributing to soil and stream acidification. Sulfate deposition exceeds SO4 stream levels throughout the 45-year simulation, suggesting that soil capacity to absorb sulfate continues6.
Aluminum in soil solutions decreased over the 45-year simulation in response to reduced SO4 and NO3 deposition6. The ratio of calcium to aluminum (Ca/Al) in soil solutions has been used as an indicator of forest health12. Aluminum in soil solutions can be toxic to plant roots and competes with calcium and magnesium for availability in soils and uptake by roots. The risk of adverse impacts to tree growth or nutrition is estimated to be 50% where the Ca/Al ratio of soil solutions is as low as 1.0. The risk increases to 100% at soil solution Ca/Al ratio of 0.2 12. The Ca/Al ratio in soil solutions in the Noland Divide spruce fir forest is less than 1.0. The NuCM model projects that under current deposition and for projected future deposition at current levels, Ca/Al levels will remain below 1. Using the Ca/Al ratio as an indicator, the health of the spruce fir forest is likely to remain at risk under continued current deposition levels. NuCM projects that under reduced SO4 and NO3 deposition, the Ca/Al ratio will increase above 1, with greater increases in the ratio for larger deposition reductions. The increased Ca/Al ratios indicate improved forest health conditions under reduced SO4 and NO3 deposition.
White Oak Run:
The oak-dominated hardwood forest has been disturbed by logging and fires since the 1930s and by gypsy moth infestation in the past decade. The watershed is underlain by siliciclastic sandstone and soils are strongly acidic.
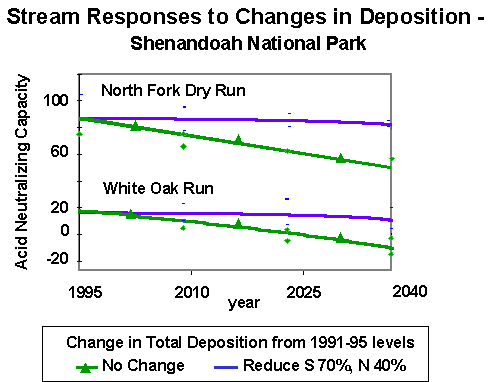
Stream ANC under current conditions is in the range 0-20 meq/l. Stream ANC responded to SO4 deposition changes but showed little response to NO3 deposition changes 5,6. With no change from 1991- 1995 SO4 deposition levels, both models predict that stream ANC in 2040 would fall below 0 meq/l. Even with 70% SO4 reductions from 1991-1995 levels, both models project that stream ANC in 2040 would remain below 20 meq/l (Figure 3). No scenario allowed stream ANC to increase above 20 meq/l. These results are consistent with our understanding that the siliciclastic bedrock geology of the watershed affords little buffering capacity to the stream. NO3 deposition changes had little impact on stream NO3 levels or ANC since most NO3 was retained in the watershed. Nitrogen retention in the watershed is consistent with the nitrogen requirements of the recovering forest.
NuCM projects that Ca would decrease and Al would increase in soil solutions over the simulation to 2040. For all scenarios, Ca/Al ratios decreased below 1.0 by 2010 and remained below 1.0 in 2040, indicating risk greater than 50% for adverse forest growth and nutrition effects.
Figure 3: Trends in stream water acid neutralizing capacity (ANC) as function of changes in future deposition levels for two streams in Shenandoah National Park
North Fork Dry Run:
The oak-dominated hardwood forest is 50-80 years old and has been disturbed by gypsy moth infestation in the past decade. The watershed is underlain by basaltic and granitic components and soils are acidic.
Stream ANC under current conditions is in the range 75-100 meq/l. Stream ANC responded to changes in SO4 deposition and to a lesser extent to changes in NO3 deposition. The models project that stream ANC in 2040 would range between 55 and 100 meq/l, depending on the deposition scenario (Figure 3). None of the scenarios were projected to cause stream ANC to drop below 50 meq/l or to increase above 150 meq/l. These results are consistent with the expectation that the basaltic bedrock would provide buffering for stream water quality. Little of the sulfate currently deposited to the watershed is being retained, indicating that the accumulation of sulfate from previous years has brought the sulfate adsorption of the watershed into steady state with atmospheric inputs. Less NO3 was retained in the North Fork Dry Run watershed than in White Oak Run.
Ca in soil solutions decreased and Al increased in 2010 and 2040 compared to 1990 for all deposition scenarios6. The Ca/Al ratio dropped from near 5 in 1995 to 2-3 by 2010, depending on deposition scenario. These levels are above the threshold of 1.0 but indicate soil acidification.
Influence of Calcium Deposition on watershed responses
Deposition of calcium, magnesium, and other base cations has decreased since the 1980s13. SAMI evaluated two cases where base cation deposition (calcium, magnesium, sodium, and potassium) was reduced by 20% from 1991-1995 average values. These 20% reductions were in addition to 20% NO3 reductions and 30 or 70% SO4 reductions.
In all three watersheds, the differences in stream base cations and ANC as function of reduced cation deposition were small 5,6. Effectively the reductions in base cations offset decreases in acidity due to SO4 and NO3 reductions. These results are similar to those reported previously 14,15 and suggest that benefits of reduced SO4 and NO3 deposition may be less than anticipated if deposition of base cations continues to decrease in future years.
Phase II
Regional Assessment
SAMI’s Phase II acid deposition assessment will:
· classify the current sensitivity of streams and forests in the SAMI region
· model responses of representative streams and forests to changes in future deposition levels as a function of SAMI strategies
· extrapolate from modeled responses to interpret regional changes in stream (quantitative) and forest (qualitative) sensitivity distributions.
MAGIC will be used for regional assessment of stream water quality responses to changes in future deposition levels. NuCM will be applied to assess nutrient levels in forest, soil, and soil solutions of specific watersheds in response to changes in deposition levels.
CONCLUSIONS
· To protect sensitive watersheds such as modeled in the SAMI Phase I analyses may require large (40-70%) reductions in NO3 and SO4 deposition compared to 1990 levels
· SO4 reductions will be of the greatest benefit for watersheds where geology and soils offer poor buffering from acidification
· NO3 reductions will be of greatest benefit to high elevation forests where current deposition exceeds the ability of the slower-growing mature forests to take up nitrogen
ACKNOWLEDGEMENTS
SAMI’s integrated assessment is funded by a combination of EPA, state, and private sector contributions as well as significant in-kind contributions and committee participation by SAMI members. The authors with to acknowledge the contributions of the SAMI Effects Subcommittee to the design and review of this assessment of acid deposition effects to streams and forests in the Southern Appalachian Mountains.
REFERENCES
1) Brewer, P. F. Southern Appalachian Mountains Initiative: A Regional Partnership for Air Quality Management. In Proceedings of Annual Meeting of Air and Waste Management Association, St. Louis, Missouri, June 1999.
2) Neeley, D., Brantley, W. P., and Brewer, P. F. Southern Appalachian Mountains Initiative: An Overview. In Proceedings of Annual Meeting of Air and Waste Management Association, St. Louis, Missouri, June 2000.
3) Odman, T., Boylan, J., Wilkinson, J., Yang, Y-J, Russell, A. G. Ozone Modeling for the Southern Appalachian Mountains Initiative. In Proceedings of Annual Meeting of Air and Waste Management Association, Salt Lake City, UT, June 2000.
4) Boylan, J., Wilkinson, J., Yang, Y-J, Odman, T., Russell, A. G. Particulate Matter and Acid Deposition Modeling for the Southern Appalachian Mountains Initiative. In Proceedings of Annual Meeting of Air and Waste Management Association, Salt Lake City, UT, June 2000.
5) Cosby, B.; Sullivan, T. Application of the MAGIC Model to Selected Catchments: Phase I Southern Appalachian Mountains Initiative; Prepared for the Southern Appalachian Mountains Initiative, Final Report, March 1999.
6) Munson, R. Application of the NuCM Model to Noland Divide, White Oak Run, and Shaver Hollow for SAMI Phase I; Prepared for the Southern Appalachian Mountains Initiative, Final Report, March 1999
7) Herlihy, A.; Kaufmann, P.; Stoddard, J.; Eshleman, K.; Bulger, A. Effects of Acidic Deposition on Aquatic Resources in the Southern Appalachians with a Special Focus on Class I Wilderness Areas; Report prepared for the Southern Appalachian Mountains Initiative, August 1996.
8) Bulger, A. J., C. A. Dolloff, B. J. Cosby, K. N. Eshlemna, J. R. Webb and J. N. Galloway. 1995. The “Shenandoah National Park: Fish in Sensitive Habitats” project. An Integrated Assessment of Fish Community Responses to Stream Acidification. Water, Air, and Soil Pollution 85: 309-314.
9) R. H. Whittaker. 1956. Vegetation of the Great Smoky Mountains. Ecological Monographs 26:1-80.
10) Shannon, J. D., Calculation of Trends from 1900 through 1990 for Sulfur and NOx-N deposition, Concentrations of Sulfate and Nitrate in Precipitation, and Atmospheric Concentrations of SOx and NOx Species over the Southern Appalachians, Report to the Southern Appalachian Mountains Initiative, April1998.
11) Systems Applications International, Inc. Episode Selection for the Integrated Analysis of Ozone, Visibility, and Acid Deposition for the Southern Appalachian Mountains; Report prepared for the Southern Appalachian Mountains Initiative, June 1998.
12) Cronan, C. S., and Grigal, D. F. 1995. “Use of Calcium/Aluminum Ratios as Indicators of Stress in Forest Ecosystems”, Journal of Environmental Quality, 24:209-226.
13) Lynch, J.A., Grimm, J.W., and Bowersox, V.C. 1995. Trends in precipitation chemistry in the United States: A national perspective 1980-1992. Atmospheric Environment 29:1231-1246.
14) Johnson, D.W., Susfalk, R.B., Brewer, P.F., and Swank, W.T. 1999. Simulated Effects of Reduced Sulfur, Nitrogen, and Base Cation Deposition on Soils and Solutions in Southern Appalachian Forests, Journal of Environmental Quality 28:1336-1346.
15) Likens, G.E,., Driscoll, C.T., and Buso, D.C. 1996. Long-term effects of acid rain:Response and recovery of a forest ecosystem. Science 272:244-246.
Key Words
Acid deposition effects, stream chemistry, forest nutrients, watershed response models