Visibility Analyses for the Southern Appalachian Mountains
Cindy Huber, Patricia Brewer, Diane Ducharme
USDA Forest Service, 5162 Valleypointe Pkwy, Roanoke, VA 24019; Southern Appalachian Mountains Initiative, 59 Woodfin Place, Asheville, NC 28801 (second and third authors);
ABSTRACT
The Southern Appalachian Mountains Initiative (SAMI) is evaluating emissions management strategies to protect air quality and air quality related values in the Southern Appalachian Mountains. SAMI’s Integrated Assessment links emissions, atmospheric transport, environmental effects, and socioeconmic consequences to evaluate impacts of air emissions management strategies. SAMI’s visibility analyses have been conducted in two phases. Phase I analyses relied on observational data from five monitoring stations in Class I areas of the Southern Appalachian Mountains that are operated as part of the Interagency Monitoring of Protected Visual Environments (IMPROVE) network and also the Southeastern Aerosol and Visibility Study (SEAVS) conducted at Look Rock in the Great Smoky Mountains National Park in July and August 1995. A simple algorithm was used to relate aerosol species mass, as a function of relative humidity and light extinction efficiency, to measures of visibility. Different assumptions for light scattering efficiency and hygroscopicity of aerosol species were tested. The Phase I analyses did not attempt to link changes in aerosol mass to changes in emissions. SAMI’s Phase II visibility analyses will be linked to SAMI’s atmospheric modeling outputs. The Urban Regional Model projects aerosol mass for 68 days in 9 week-long episodes selected to represent air quality in Great Smoky Mountains and Shenandoah National Parks for the period 1991 to 1995. Visibility responses to changes in aerosol mass will be projected for 2010 and 2040 for the nine episodes for SAMI emissions strategies. As an example, for the July 11-19, 1995 episode, aerosol levels in 2010 have been projected for two future emissions projections representing implementation of federal air regulations. Assuming July 1995 meteorological conditions, a 31% decrease in sulfur dioxide in the eastern United States (representing implementation of the 1990 Clean Air Act Amendments) is projected to reduce sulfate aerosol mass at Look Rock in Great Smoky Mountains National Park by 18% on July 12 and by 25% on July 15. Visibility is projected to change by 0.8 and 1.9 deciviews, respectively, on these two days in response to aerosol changes. These results are an example of the analyses that SAMI is performing for other sites, days, and SAMI emissions strategies.
INTRODUCTION
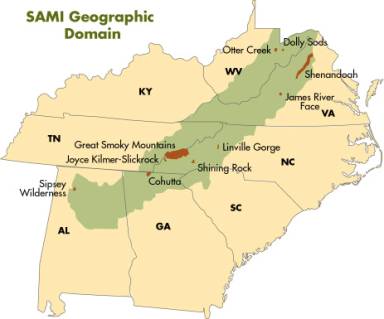
The Southern Appalachian Mountains Initiative (SAMI) is a voluntary partnership of state and federal agencies, industry, environmental groups, academia, and interested public. SAMI was established to identify and recommend air emissions management strategies to remedy existing and prevent future adverse air quality impacts to natural resources in Southern Appalachia, with particular focus on Class I national park and wilderness areas (Figure 1).
Figure 1. Geographic Domain of Southern Appalachian Mountains Initiative including 10 Class I national parks and wilderness areas
SAMI’s integrated assessment is focusing simultaneously on ozone, visibility impairment, and acid deposition. Computer models are linking emissions, atmospheric transport, exposures, and environmental and socioeconomic effects. The assessment is considering the impacts of federal air regulatory requirements and emissions management strategies that SAMI might recommend for regional, state, or community-based actions.
Emissions inventories are being developed for future years for each SAMI strategy. Inventories include precursor emissions for aerosols, ozone, and acid deposition. Emissions of sulfur dioxide (SO2), nitrogen oxide (NOx), carbon monoxide (CO), volatile organic compounds (VOC), particles less than 10 and less than 2.5 microns (PM10 and PM2.5), ammonia (NH3), elemental carbon (EC), and primary sulfate and nitrate (SO4 and NO3) are being developed for major source sectors (utility, industrial, highway vehicle, non-road engines, and area source sectors)1 . Inventories have been developed for the 1990 base year, for specific episodes between 1991 and 1995, and for future years 2000, 2010, 2020, 2030, and 2040 2.
SAMI is using an episodic atmospheric modeling approach to project air quality in 2010 and 2040 in response to SAMI emissions management strategies. Ozone, aerosols, and deposition are being evaluated in a single atmospheric model, the Urban Regional Multi-scale (URM) model 3. Sixty-eight days in nine week-long episodes were selected to represent air quality and meteorological events for a five-year period (1991-1995) in Great Smoky Mountains and Shenandoah National Parks 4. By winter 2000, model performance has been evaluated for 5 episodes 3,5 and air quality in 2010 has been projected for one episode and two SAMI strategies. SAMI’s visibility, ozone, and acid deposition effects assessments are using atmospheric model results to project the impacts of future air quality.
VISIBILITY
ASSESSMENT
SAMI’s visibility assessment is projecting changes in light extinction, deciviews, and visual range in response to changes in aerosol mass, size, and composition. Visibility assessments are being conducted in two phases. Phase I analyses 6, conducted in 1997, were based on monitoring records from five IMPROVE monitoring stations in the Southern Appalachian Mountains and from the Southeastern Aerosol and Visibility Study (SEAVS) conducted at Look Rock in the Great Smoky Mountains National Park in July and August, 1995. The IMPROVE record includes up to 10 years of aerosol and visibility data collected in a uniform manner over several Class I areas in Southern Appalachia. IMPROVE aerosol samples are collected for two 24-hour periods per week. The SEAVS study was a six-week intensive monitoring study in July and August 1995 with daily collections of 2, 12-hour aerosol samples7. The study evaluated several different aerosol monitoring methods and emphasized speciation of organic mass and measurements of the contributions of relative humidity to aerosol mass and visibility impairment.
A simple algorithm was used in the SAMI Phase I analyses to relate aerosol species mass, as a function of relative humidity and light extinction efficiency, to measures of visibility. Different assumptions for light extinction efficiency and hygroscopicity of aerosol species were tested. Analyses evaluated the benefits to visibility, as measured by deciviews, of changes in aerosol mass on specific days from the IMPROVE and SEAVS records. Across sites and meteorological conditions, sulfate aerosols were the largest contributors to aerosol mass. Organic aerosols were the second largest contributors with soil dusts and nitrate aerosols making smaller contributions6. The Phase I analyses did not attempt to link changes in aerosol mass to changes in emissions.
SAMI’s Phase II visibility analyses will use aerosol levels projected by the atmospheric model to project visibility responses to SAMI strategies. The same algorithm used in Phase I analyses will be applied to calculate light extinction as a function of modeled aerosol mass and relative humidity.
The objective of Phase II analyses is to evaluate visibility responses to changes in aerosols concentrations that are projected by the atmospheric model in response to SAMI emission strategies. Atmospheric model results will be projected for two future years, 2010 and 2040, for two emissions cases representing implementation of federal regulations, and several SAMI emission strategies.
METHODS
Response Curves
For both the Phase I and Phase II visibility analyses, a simple algorithm is used to relate aerosol species mass, as a function of relative humidity and light extinction efficiency, to measures of visibility (light extinction, deciview, and standard visual range). Extinction efficiencies are measures of the extent that a given aerosol interferes with the transmission of light, and hence reduces visibility. The following equation6, based on Mie theory, is used to calculate the change in extinction for the specified change in aerosol concentration.
D bext = E i dry x fi(RH) x D ci (1)where
D bext = the change in extinction caused
by the change in concentration,
Ei dry = the dry extinction efficiency of species i,
D ci = the change in concentration of species i,
f i (RH) = factor which compensates for the effects of relative humidity.
Phase I analyses tested several alternative response curves that reflected differences in analytical results and interpretations by IMPROVE and SEAVS scientists in defining dry scattering efficiencies (Table 1) and the effects of relative humidity.
Table 1. Alternative assumptions for light extinction efficiency in SAMI Phase I analyses.
|
Species |
Alternative A1 |
Alternative B2 |
Alternative C2 |
Alternative D2 |
Alternative E3 |
|
Ammonium Sulfate |
3 x f (RH) |
5.0 x f(RH) |
4.2 x f(RH) |
3.7 x f(RH) |
3.9 x f(RH) |
|
Ammonium Nitrate |
3 x f(RH) |
3 x f(RH) |
3 x f(RH) |
3 x f(RH) |
3 x f(RH) |
|
Organic Mass |
4 |
4 |
6.1 |
6.1 |
5.4 x f(RH) |
|
Elemental Carbon |
10 |
10 |
11.5 |
11.5 |
11.5 |
|
Soil |
1 |
1 |
2.5 |
2.5 |
2.5 |
|
Course |
0.6 |
0.6 |
0.6 |
0.6 |
0.6 |
1 Extinction efficiencies
used by IMPROVE
2 Extinction efficiencies
based on different monitoring approaches during SEAVS study
3 Assuming that organic
aerosols are hygroscopic, upper bound assumptions for extinction efficiency of
organic aerosols
For both Phase I and II analyses, the extinction efficiencies were assumed to be effectively constant over the range of aerosol concentrations of interest, and aerosol species were assumed to behave in mixtures in the same manner as if they were acting independently.
Episode Selection
Phase II visibility analyses rely on atmospheric modeling results to project changes in aerosol mass and visibility in response to SAMI strategies. Episodes were selected for atmospheric modeling to represent the summer and annual distribution of aerosol mass in Great Smoky Mountains National Park and Shenandoah National Park. The air quality and meteorological records for Look Rock in Great Smoky Mountain National Park and Big Meadows in Shenandoah National Park were the basis of episode selection. Days with valid monitoring data from the IMPROVE records for 1991 to 1995 were classified based on similarity of meteorological conditions and contributions to summer and annual distribution of daily aerosol mass for visibility4. Sixty-eight days in nine 7-10 day episodes were selected to minimize the combined error in representing ozone, aerosols, and acid deposition.
IMPROVE data exists for 27 of the 68 modeled days to evaluate model performance. The selected modeling days represent, with known frequency of occurrence, all other days in the 1991-1995 record for Look Rock and Big Meadows. Table 2 represents the days selected for modeling aerosols in both the Great Smoky Mountains and Shenandoah National Parks.
Table 2. Days selected to represent aerosol mass and visibility in SAMI’s atmospheric modeling, based on IMPROVE records for 1991 to 1995 for the Great Smoky Mountains National Park (GRSM) and Shenandoah National Park (SHEN).
|
Visibility
Days |
Class
11 |
Class
2 |
Class
3 |
Class
4 |
Class
5 |
|
GRSM
|
930327 |
930324 |
930515 |
920624 |
910727 |
|
|
940209 |
950426 |
930804 |
930811 |
910731 |
|
|
940212 |
|
930807 |
950527 |
950715 |
|
|
|
|
950429 |
950712 |
|
|
|
|
|
|
|
|
|
SHEN |
930331 |
930324 |
930515 |
910724 |
950712 |
|
|
940209 |
950426 |
930804 |
910731 |
950715 |
|
|
940212 |
950429 |
950527 |
920624 |
|
|
|
|
950503 |
950719 |
920627 |
|
|
|
|
|
|
930512 |
|
|
|
|
|
|
930807 |
|
|
|
|
|
|
930811 |
|
|
|
|
|
|
950524 |
|
1 Episode dates are displayed with year first, month,
and day.
Each of the 27 days represents one of five classes of days, defined by the combined aerosol mass (micrograms per cubic meter) of sulfate, nitrates, organics, and soil (Table 3). Each Class represents a percentage of the annual frequency distribution for aerosol mass. Class I days are those days with the lowest 20% aerosol mass in the annual record (0-5.0 mg/m3). The Class IV and V days, combined, are the days with the highest 20% aerosol mass in the annual record. Aerosol mass values for Class IV and V range from 15.8 to 24.9 mg/m3 and from 24.9 to 41.5 mg/m3, respectively. This classification scheme is similar to that used in the Regional Haze Rule, except that the Regional Haze Rule is based on visibility metrics rather than aerosol mass. Different episode days were selected to represent the annual loading for each national park and thus number of days per Class differs for the two parks.
Table 3. Visibility classifications for Great Smoky Mountains National Park (GRSM) and Shenandoah National Park (SHEN).
|
|
Class I2 |
Class II |
Class III |
Class IV |
Class V |
|
Annual Frequency (% )1 |
20 |
30 |
30 |
17 |
3 |
|
Concentration (mg/m3) |
0 - 5.0 |
5.0 - 9.1 |
9.1 - 15.8 |
15.8 - 24.9 |
24.9 - 41.5 |
|
# days per class: GRSM |
3 |
2 |
4 |
4 |
3 |
|
# days per class: SHEN |
3 |
4 |
4 |
8 |
2 |
1 Annual frequency
distribution is based on combined aerosol mass of
sulfate, nitrate, organics, and soil.
2 Classes of days based on meteorological records and IMPROVE aerosol records from 1991 to 1995 at Look Rock (GRSM) and Big Meadows (SHEN)
Air quality exposures in 2010 and 2040 will be modeled for the nine episodes and up to nine emissions management strategies per episode. Results for the nine episodes will be synthesized to project 2010 and 2040 annual and summer distributions for daily aerosol mass and species composition. Based on the classification metrics for the two parks, SAMI will interpolate air quality in the other SAMI Class I areas and the SAMI geographic domain.
RESULTS
Model Performance
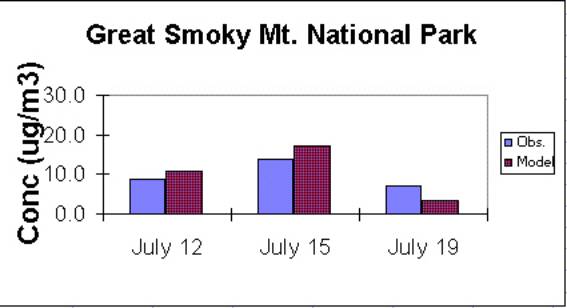
Across four episodes and several IMPROVE monitoring sites, the atmospheric model, URM, has demonstrated fairly good agreement between measured and modeled sulfate aerosols5. For example, modeled sulfate aerosol mass for July 12, 15, and 19, 1995, at Look Rock, GRSM, is compared to measured sulfate aerosol from the IMPROVE records for these three days (Figure 2). Modeled sulfate aerosol mass is higher than measured on July 12 (by 15%) and July 15 (by 22%). On July 19, modeled sulfate aerosol mass is 50% lower than measured. Modeled nitrate is higher than measured nitrate while modeled organics under represent measured organics all three days. Modeled PM2.5 mass was 10-20% greater than measured PM2.5 mass for the three days.
Figure 2. Aerosol mass on July 12, 15, and 19 at Look Rock in
Great Smoky Mountains National Park as measured by IMPROVE and as modeled by
the Urban Regional Multiscale (URM) model
![]()
Visibility
Responses to Changes in Aerosol Mass
URM
results project that a 31% reduction in sulfur dioxide emissions in the eastern
United States (representing implementation of 1990 Clean Air Act Amendments)
will reduce sulfate aerosol mass at Look Rock by 18% on July 12 and by 25% on
July 15. Accompanying these reductions
in sulfate aerosol are increases in nitrate aerosol. Organic aerosols are unchanged.
The following is an example of how SAMI might use the modeling results
in the Phase II visibility analysis.
To
calculate the changes in visibility response due to changes in aerosol mass
projected by the atmospheric model, the same algorithm used in Phase I analyses
is used here for Look Rock on July 12 (Table 4) and July 15 (Table 5). In order to focus on the visibility
response to aerosol mass change, relative humidity and the accompanying f(RH)
was held constant at the measured IMPROVE values for these calculations.
Table 4. Aerosol mass and visibility at Look Rock in Great Smoky Mountains National Park for July 12, 1995 as measured by IMPROVE and modeled by URM.
|
Aerosol
Species mg/m3
- 24 hour cumulative1 |
7/12/1995 IMPROVE |
7/12/1995
URM model |
7/12/2010 URM model (2010 emissions) |
|
Ammonium Sulfate |
11.98 |
13.67 |
11.17 |
|
Ammonium Nitrate |
.19 |
.49 |
1.10 |
|
Organics |
5.05 |
2.71 |
2.69 |
|
Elemental Carbon |
.61 |
0.87 |
0.74 |
|
Soil |
0.57 |
3.28 |
4.02 |
|
Coarse |
12.00 |
12.36 |
14.44 |
|
Average Relative Humidity (%) |
64 |
66 |
66 |
|
Total Extinction (bext, Mm-1) |
103.58 |
109.48 |
100.84 |
|
Deciview, dv |
23.4 |
23.9 |
23.1 |
|
Standard Visual Range (km) |
38 |
36 |
39 |
1 Same assumptions for light extinction efficiency as
alternative A, Table 1.
Table 5. Aerosol mass and visibility at Look Rock in Great Smoky Mountains National Park for July 15, 1995 as measured by IMPROVE and modeled by URM.
|
Aerosol
Species - mg/m3
- 24 hour cumulative, |
7/15/1995 IMPROVE |
7/15/1995
URM model |
7/15/2010
URM model (2010 emissions) |
|
Ammonium Sulfate |
18.34 |
23.11 |
17.27 |
|
Ammonium Nitrate |
0.17 |
.23 |
1.01 |
|
Organics |
6.70 |
2.17 |
2.15 |
|
Elemental Carbon |
0.68 |
0.76 |
0.63 |
|
Soil |
0.67 |
2.72 |
3.18 |
|
Coarse |
7.52 |
12.08 |
13.77 |
|
Average Relative Humidity
(%) |
74 |
66 |
66 |
|
Total Extinction (bext, Mm-1) |
172.06 |
191.69 |
158.09 |
|
Deciview (dv) |
28.5 |
29.5 |
27.6 |
|
Standard Visual Range (km) |
23 |
20 |
25 |
1 Same
assumptions for light extinction efficiency as alternative A, Table 1.
Aerosol mass was higher on July 15 than on July 12. Comparing visibility measures for URM model results using July 1995 and July 2010 emissions, visibility is projected to improve by 0.8 deciviews (dv) on July 12 and by 1.9 dv on July 15. The change in visibility predicted for July 12 (from 36 to 39 km standard visual range) would likely not be detectable by the human eye. The visibility improvement for July 15 (from 20 to 25 km) would be noticeable.
SAMI analyses will address changes in visibility at additional sites, days, and by seasons, for SAMI strategies.
CONCLUSIONS
A simple alogrithm can be used to relate aerosol species mass, as a function of relative humidity and light extinction efficiency, to measures of visibility. SAMI’s atmospheric model will project changes in aerosol mass in response to SAMI emissions strategies. Phase II visibility analyses will allow SAMI to compare the relative change in visibility condition between emission strategies. Results to date are too preliminary to draw conclusions about the efficiency of specific strategies. Final results are due by March 2001.
Acknowledgments
SAMI’s integrated assessment is funded by a combination of EPA, state, and private sector contributions as well as significant in-kind contributions and committee participation. The authors wish to acknowledge Scott Copeland, US Forest Service, as principal author for Phase I analyses cited herein and the SAMI Effects subcommittee for technical direction.
References
1) E.H. Pechan and Associates, Inc. Development of the SAMI 1990 Base Year Emissions Inventory, Prepared for the Southern Appalachian Mountains Initiative, January 1999.
2) Ogburn, C., Boothe, L., Mullen, M., Brewer, P.F. Emissions Inventories for the Southern Appalachian Mountains Initiative. In Proceedings of Annual Meeting of the Air and Waste Management Association, Salt Lake City, UT, June 2000.
3) Odman, T., Boylan, J., Wilkinson, J., Yang, Y-J, and Russell, A. G. Ozone Modeling for the Southern Appalachian Mountains Initiative. In Proceedings of the Annual Meeting of the Air and Waste Management Association, Salt Lake City, UT, June 2000.
4) Systems Applications International, Inc. Episode Selection for the Integrated Analysis of Ozone, Visibility, and Acid Deposition for the Southern Appalachian Mountains; Prepared for the Southern Appalachian Mountains Initiative, June 1998
5) Boylan, J., Wilkinson, J., Yang, Y-J, Odman, T., and Russell, A. G. Particulate Matter and Acid Deposition Modeling for the Southern Appalachian Mountains Initiative. In Proceedings of the Annual Meeting of the Air and Waste Management Association, Salt Lake City, UT, June 2000.
6) Copeland, S. Draft Phase I Visibility Effects Analysis; Prepared for the Southern Appalachian Mountains Initiative, June 1999
7) Saxena, P., Andrews, E., Musarra, S. Southeastern Aerosol and Visibility Study (SEAVS): Concentration and Composition of Atmospheric Aerosols at Look Rock, TN, July-August 1995. Report # TR-111063 for Electric Power Research Institute, July 1998
Key Words
Visibility, light extinction efficiency, aerosol mass, deciview